Wetland Nitrous Oxide Emissions
Our Projects
Participants
Lei Tao, Kang Sun, John Buglione and Mark Zondlo
Experimental Apparatus
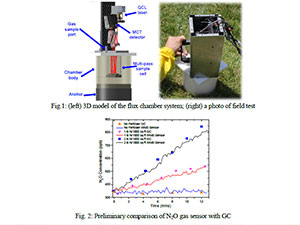
A compact and portable laser-based gas sensor for open-path nitrous oxide (N2O) detection has been developed in the atmospheric chemistry group of Princeton University. Static flux chamber is widely used as a general method to measure the N2O emission flux from soil. However, it is a labor-intensive method with limited spatial and temporal resolution. Laser-based gas sensor can provide fast and accurate measurement in real-time. Thus, we have integrated our N2O sensor into a flux chamber to improve the performance of static flux chamber. The experimental apparatus as well as a photo of a recent field test performed in April, 2012 are shown in Fig. 1. A custom flux chamber (11 inch in height, 8 inch in diameter, made of polyethylene) has been designed to host the sensor for real-time soil flux measurement. During that field test, we have compared our gas sensor measurements with the measurements from a gas chromatography (GC) from the same chamber at the same time for different soil treatments (by adding different amount of fertilizers into the soil). A decent agreement between two methods has been found in the preliminary comparison as shown in Fig. 2.
There is a lack of understanding on the dynamics that influence the quantity of greenhouse gas (CO2, CH4, N2O) emanating from wetlands. Lots of factors including salinity, tidal flows, wetlands composition and plant species may affect the extent of greenhouse gases released from the wetlands. Limited by instrument, such measurements in wetlands are difficult, challenging and labor-intensive. Thus, we propose to test our laser based sensor in tidal wetlands at the Hackensack Meadowlands, NJ.
Test Process
The electronic control box for the sensor and a laptop for data acquisition were placed on a three tier shelf. The laser sensor was connected to the control box with 4-m long cables, which were used for a recent flux tower deployment. The sensor system measured and recorded the concentration of N2O inside the chamber at 10 Hz. A small semiconductor sensor was attached inside the chamber to record the air pressure and temperature of the chamber every 1 second. Unfortunately, we only measured chamber #1 and #2 before the one of the cable dropped into the water and shorted the power supply.
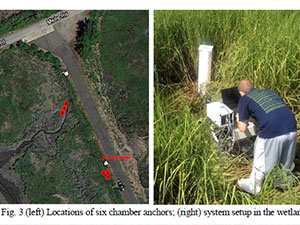
Six chamber anchors were placed in different locations at the wetland of Meadowlands, a week before the test as shown in Fig. 3 (left). First three anchors (#1, #2 and #3) were placed in a vegetated wetland. Anchor #1 had grasses inside, while there were no grasses inside anchor #2 or #3. The rest three ones (#4, #5 and #6) were placed at a non-vegetated location. The maximum tidal height at the tested locations is about 20-30 inches. As a result, a new chamber body (30 inches height) was machined as shown in Fig. 3 (right).
Test Results and Discussion
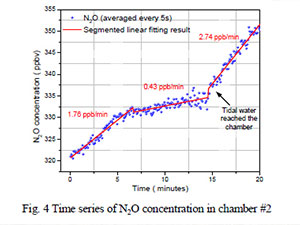
The first measurement was done with chamber #2 for ~20 minutes, while the tidal water was rising. Figure 4 shows the measurement result for chamber #2. The concentration of the N2O inside the chamber didn’t increase in a constant rate during the measurement. As a result, a segmented linear fitting was used to fit the experimental result at three different segments as plotted in Fig. 4. Before we installed the chamber body, the tidal water hadn’t reached the anchor yet. However, the water reached the outside of the chamber after 15 minutes test. The N2O emission flux inside the chamber shows a clear increase at the same time. We noticed the chamber was so well sealed that there was no water leaked inside the chamber, while water was rising outside it. Such increase of N2O flux might be potentially due to the air (which contains more N2O.) pushed out from soil by water. The averaged N2O flux for chamber #2 in 20 minutes is about 2.43 g/(m2·min).
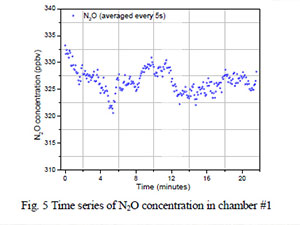
We measured chamber #1 after chamber #2, when the water was already about 4 inches above the soil. Chamber #1 hosted some grasses that were taller than the chamber body. Thus, we folded grasses to fit them inside the chamber. Figure 5 plots the time series of measured results. At the beginning of the measurement, there is a negative trend of N2O concentration for chamber #1. The elevated N2O concentration could be caused by emission from nearby traffic or residual from the previous measurement. (Note that we didn’t intentionally flush the chamber body with ambient air.) Overall, there was no distinct N2O flux measured in chamber #1.
In conclusion, the N2O fluxes from wetlands have been measured in two chambers during the rising period of a tidal circle. The laser sensor shows enough resolution both in time and concentration for such flux measurements. For this initial test, a temporal change of N2O flux has been observed related to the rise of tidal water, although further validations are needed. The laser sensor system shows its great potential in providing better measurements for understanding the dynamics of N2O emissions from wetland. However, our system needs better water protective design to make it more feasible and robust for wetland applications.