Sea Level Rise Measurements
Our Projects
Project Lead
Joe Grzyb
Background
Findings at Jamaica Bay have documented a loss of over 300 hectares of wetlands (Hartig et al. 2001, 2002). Additionally, many marshes along the north and south shores of Long Island have experienced significant marsh loss (NYSDEC 2006). Many of these marshes have now become coastal shoals and mudflats. An article in The New York Times (August 2, 2007) announced that “Jamaica Bay Loses Marshes at Faster Rate, report says; Disappearance in Five Years is Feared.” In response to these discoveries, and starting in 2008, MRRI staff, in cooperation with USGS, began measuring marsh elevation changes at the Meadowlands estuary using Surface Elevation Tables (SETs) and feldspar markers (Cahoon & Lynch 2005). Dr. Cahoon and Dr. Lynch from USGS toured the Hackensack estuary and made recommendations for SET installation and monitoring, equipment needs, site selection, timing, and training. Monitoring sediment accretion on marsh platforms will allow us to determine accretion rates, compare them to other East Coast estuaries, and prioritize the most affected sites for restoration.
Results
Phase 1: Purchase equipment and site selection
Site selection: The following sites were selected to represent Hackensack Meadowlands natural and restored sites tidal marsh vegetation.
- Secaucus High School Low Marsh (restored)
- Sawmill (SM) High Marsh (natural)
- Sawmill (SM2) Low Marsh (Spartina Alterniflora)
- Riverbend (RB) High Marsh (natural)
- Riverbend (RB) Mixed Marsh (Spartina patens and Phragmites) [natural]
- Lyndhurst Riverside (LR) High Marsh (Phragmites) [restored]
The six sites selected include a restored Spartina alterniflora low marsh, a Spartina patens dominated high marsh, a mixed Spartina patens and Phragmites australis high marsh and 2 natural Spartina alterniflora dominated low marsh.
- Eight Day Swamp (Phragmites)
- Walden Swamp (Phragmites)
- Toll Gate Marsh (Phragmites)
- Ackerman Marsh (Phragmites)
- Never Touch Marsh (Phragmites)
The five Berry’s Creek sites selected are all natural Phragmites marsh. These sites extend from close to the mouth of Berrys Creek (Toll Gate Marsh) all the way up to Moonachie Ave and Teterboro Airport. (Never Touch Creek Marsh)
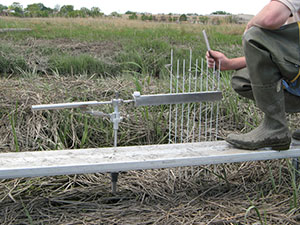
Phase 2: Installation of SET benchmark rods and Marker Horizons
Marker horizons are commonly used in conjunction with the SET. Marker horizons measure vertical accretion which predominantly incorporates Surface Processes.
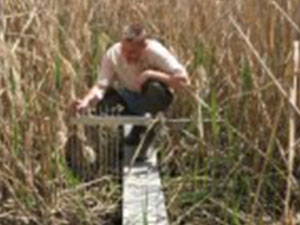
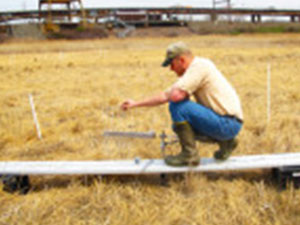
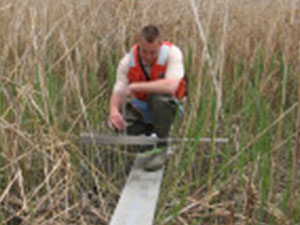
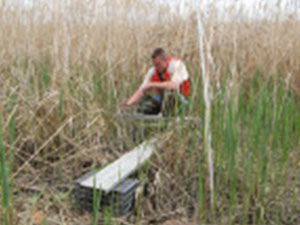
SET benchmark rods installation: The first SET benchmark rods were installed in Spring 2008 under the guidance and supervision of USGS team member Jim Lynch. Installation took place over two days. MRRI personnel supported the field work.
Three benchmarks were installed at each of the eleven sites for a total of thirty-three benchmarks. As part of the installation phase, each benchmark location will be surveyed and mapped by MRRI using GPS.
Marker Horizons placement: Feldspar and/or sand will be used as markers and it will be placed near each benchmark.
Phase 3: Data Collection
At each benchmark, Surface Elevation Table (SET) will be read at four different positions (one statistical unit). The thirty-three units will be read annually during the months of October, November and December. Special care must be taken to ensure that readings are obtained in a consistent manner.
Phase 4: Data Analysis and Reporting
Data analysis and report preparation will be conducted by Joe Grzyb of MRRI. Initial monitoring results will be analyzed and a report will be prepared within 2 months after the final measurements.
REFERENCES
Cahoon, Donald R. and J. Lynch. 2005. Surface Elevation Table (SET). Retrieved 9 January 2007 from: http://www.pwrc.usgs.gov/set/ Gornitz, V., S. Couch, and E.K. Hartig. 2002. Impacts of sea level rise in the New York City Metropolitan Area. Global and Planetary Change 32:61-88. Gornitz, V. Sea Level Rise and Coasts. Chapter 3. In Rosenzweig, C. and W.D. Solecki (Eds.). 2001. Climate Change and a Global City: The Potential Consequences of Climate Variability and Change – Metro East Coast. Report for the U.S. Global Change Research Program, National Assessment of the Potential Consequences of Climate Variability and Change for the United States, Columbia Earth Institute, New York. 224p. Accessed 2 August 2006 from http://ccsr.columbia.edu/cig/mec/05_Wetlands.pdf. Hartig, E.K. Wetlands. Chapter 5. In Rosenzweig, C. and W.D. Solecki (Eds.). 2001. Climate Change and a Global City: The Potential Consequences of Climate Variability and Change – Metro East Coast. Report for the U.S. Global Change Research Program, National Assessment of the Potential Consequences of Climate Variability and Change for the United States, Columbia Earth Institute, New York.224p. Accessed 2 August 2006 from http://ccsr.columbia.edu/cig/mec/05_Wetlands.pdf. Hartig, E.K., Gornitz, V., A. Kolker, F. Mushacke, and D. Fallon. 2002. Anthropogenic and climate-change impacts on salt marshes of Jamaica Bay, New York City. Wetlands 22(1):71-89. Intergovernmental Panel on Climate Change(IPCC). 1998. The regional impacts of climate change: An assessment of vulnerability. Cambridge University Press, United Kingdom. 514 pp. New York State Department of Environmental Conservation (NYSDEC). 2006. Welcome to Marine Habitat Protection. Retrieved 22 November 2006 from: http://www.dec.state.ny.us/website/dfwmr/marine/twlossstrat.html NOAA, 2003. Historic Sea Level Trends. Center for Operational Oceanographic Products and Services (CO-OPS): http://coops.nos.noaa.gov/sltrends/sltrends.shtml Titus, J. G. 1988. Greenhouse Effect, Sea Level Rise and Coastal Wetlands. U.S. EPA Office of Policy, Planning, and Evaluation, Washington, DC, USA. EPA-230-05-86-013.