Mapping Saline Marsh Vegetation
Our Projects
Participant
MRRI
The objective of this work is to investigate if the reflectance spectra of marsh vegetation are sufficiently different to constitute unique and separate signatures that can be used to map the marsh species and physiognomic types along the environmental gradients. To this end, the medians of reflectance spectra from the canopies of dominant marsh species are compared using a set of statistical metrics to determine the similarity and their usefulness in mapping the salt marsh vegetation. If these differences can be established, marsh spectral signatures may provide the means of mapping plant physiognomic types along environmental gradients and constitute a tool for assessing the impact of tidal restriction and decreasing accretion rates on plant community composition and overall marsh biodiversity.
This study is taking place in the Meadowlands District, located in northeastern New Jersey and just three miles west of Manhattan, New York City. It is a low lying flat glacial valley with a mixture of residential and industrial land uses interspersed among expanses of landfills, marsh grass fields, tidal wetlands, creeks, mudflats and rivers, all within one of the most developed and densely populated regions of the United States. The ditching and deposition of dredge spoils on the marsh surface during the 1920’s and the removal of dikes and tide gates in the 1950’s along with storms and flooding have created and influenced the current environmental gradients within the marsh. The most common wetland species occurring in pure stands are Phragmites australis, Spartina alterniflora, Spartina patens and Distichlis spicata.
A FieldSpec ® Full Range spectroradiometer from Analytical Spectral Devices (ASD 1997) is used to collect the reflectance spectra of salt marsh vegetation in the field. Reflectance data recorded in the range from 350-2500 nm at an interval of 1.4 nm. The spectroradiometer was configured with an 8º field-of-view (FOV) lens giving an approximate 0.25 m diameter ground FOV from a height of 1.5 m from the target. Spectra measurements are made in the field under clear skies and within 1.5 hours of high sun. Measurements are referenced to a Spectralon ® white reference panel both before and after each sampling period to reduce the noise. Spectral data are recorded as apparent reflectance values, plotted to verify any inconsistencies and cropped to a range of 350 to 950 nm.
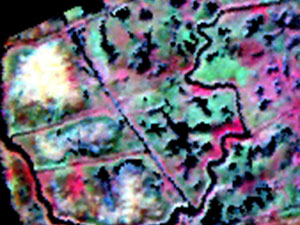
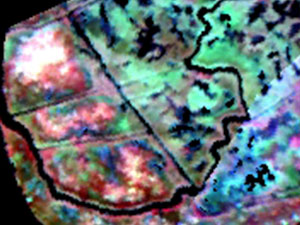
A different study was conducted to map the plant vigour gradient using hyperspectral imagery combined with field-collected seasonal reflectance spectra of marsh species in a fragmented coastal wetland. Marsh surface types were identified by classifying a low-tide hyperspectral image of New Jersey Meadowlands acquired by Airborne Imaging Specctroradiometer for Applications (AISA) in October 2000. Reflectance spectra of dominated marsh species and seasonal spectra of Phragmites australis from April to October in 2003 were measured in the field. The separability of field-collected spectra of marsh species was tested and determined using non-parametric U test. The spectra of Phragmites in greening-up phases were used as the surrogate to determine the vigour gradient of common reed stands. The results demonstrated that the reflectance spectra of one healthy stand of Phragmites sampled across the growing season did provide equivalent signatures of pure physiognomic types, which can be used to determine the plant vigour gradient.